My newest series of 10 unique digital prints and 10 unique NFTs was inspired by my daughter. We were drawing together with the paint sticks from one of our Lovevery play kits and she asked me to draw rainbows - I drew a rainbow first with the conventional color order of red, orange, yellow, green, and blue (there is no purple in the kit), but then I channeled my inner toddler and drew one with the colors in reverse order, starting with blue as the largest arc.

Researching rainbows, I re-learned from grade school that rainbows in nature always appear with the same color order due to the phenomenon of refraction and colors having different wavelengths of light. Red has the longest wavelength and violet has the shortest, and the colors appear in order from longest to shortest. When we are able to see a double rainbow, the second rainbow has the colors in reverse order.

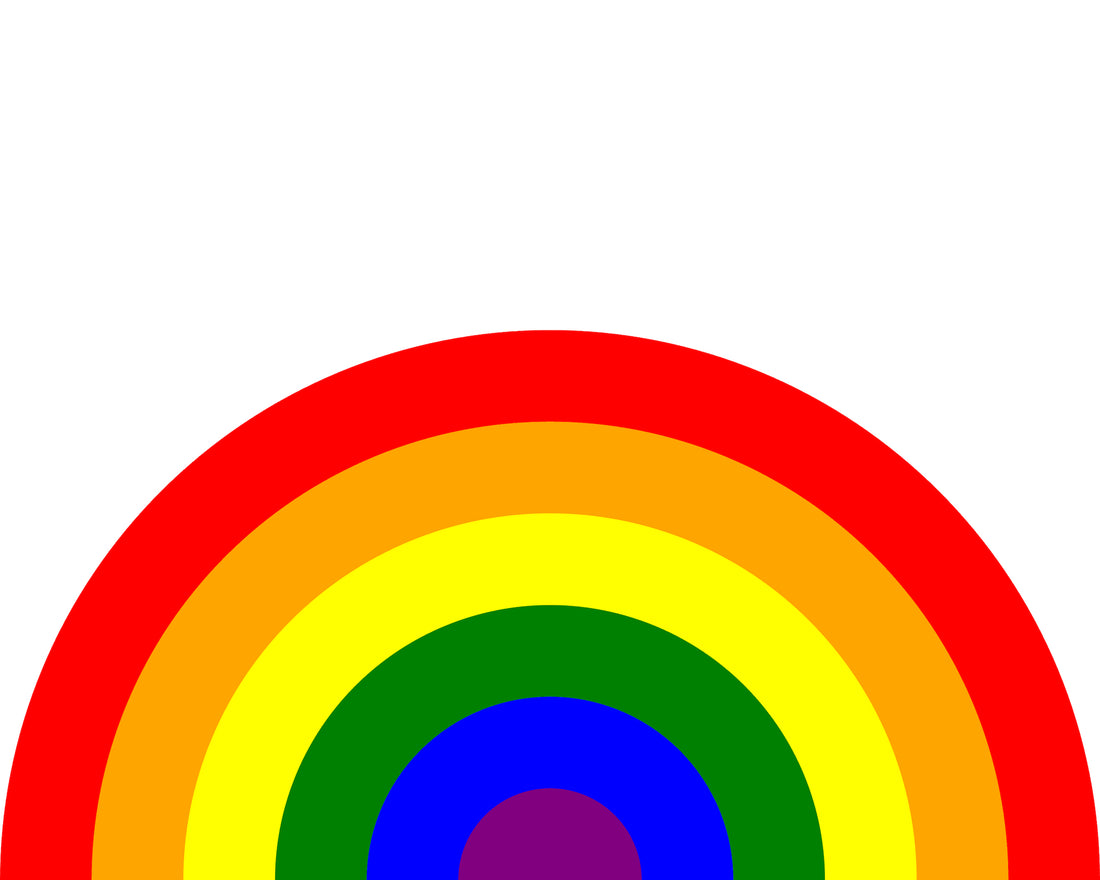
Image credit: National Science Foundation, Photo by Carlye Calvin
I wanted to explore the concept of rainbows with randomization using the color palette of the 147 named web colors.
As I was developing this series, I first created a traditional rainbow with the standard colors: red, orange, yellow, green, blue, and purple:

I then created a rainbow following the childhood mnemonic ROYGBIV color scheme:

While I like indigo and violet here, for the purpose of grouping colors and utilizing randomization within those groups, which I’ll describe below, they felt too limiting so I decided to stick with the more general purple instead. I then manually looked through the list of 147 named web colors and grouped them based on how each color visually read to me.
This process was not without nuances. Here are the 3 main points of interest:
- I referenced the MDN named color docs, which displays the colors in a list, where they are juxtaposed next to each other. Optically, colors can appear differently when viewed next to other colors. This phenomenon is called simultaneous contrast - essentially, our perception of a color can change based on nearby colors. You can observe this in the two rainbows above - the color blue is the same in both, yet in the ROYGBIV rainbow, the blue appears brighter when directly next to indigo as opposed to purple. As a result, this may have skewed how I categorized some of the colors.
- Some of the colors have red, orange, yellow, green, blue, purple or other color terms as part of their name. In some cases, the names alone may have influenced how I perceived and categorized the colors, especially if I was on the fence about which general group a color belonged in.
- Everyone sees color differently - the person who originally named some of these web colors surely saw them differently than I do! My interpretation of the colors is completely unique to me. If you had gone through this exercise, you may have interpreted and categorized some of the colors differently.
After I categorized the colors, I wrote the code to randomly choose one color from each of the six color categories for each arc of the rainbow. As I grouped the colors, I took notes on some of the observations that I made:
- I categorized cadetblue as green instead of blue
- I categorized chocolate, which I normally associate with brown, as orange
- cyan and aqua are the same color, and I categorized both as blue, so there was a higher chance that this color would be chosen by the algorithm for the blue arc
- I categorized darkcyan as green instead of blue
- I categorized darkslateblue as purple instead of blue
- I categorized darkslategray and darkslategrey as green instead of grays, which were left out entirely
- I categorized indigo, which I normally associate with blue (think dark denim), as purple
- I categorized ivory as yellow instead of white, which was left out entirely
- I categorized lavenderblush as pink, which was left out entirely
- I categorized lightsalmon, which I would usually think of as a shade of pink, as orange
- magenta and fuschia are the same color, and I categorized both as purple, so there was a higher chance that this color would be chosen by the algorithm for the purple arc
- I categorized mediumslateblue as purple instead of blue
- I categorized moccasin and navajowhite as orange
- I categorized sandybrown as orange instead of brown, which was left out entirely
- I categorized slateblue as purple instead of blue
As it turned out, there were 5 colors with blue in their name that actually looked green or purple to me and there were 5 colors that I wouldn’t normally associate with orange that were categorized as such.
As I began running my code to generate the images, I decided to open up the red category to include pinks as well, which added 4 additional colors to the original 9. I got some fun results, like this rainbow:

As I continued experimenting, I ultimately decided to remove the pinks and just stick with reds to stay true to the original rainbow color categories.
Here are some data points based on the categorizations I ended up with:
- There were a total of 9 reds, or 6% of all 147 colors
- There were a total of 10 oranges, or 7% of all 147 colors
- There were a total of 14 yellows, or 10% of all 147 colors
- There were a total of 29 greens, or 20% of all 147 colors
- There were a total of 24 blues, or 16% of all 147 colors
- There were a total of 19 purples, or 13% of all 147 colors
- That’s a total of 72% of the colors categorized as one of those 6 groupings, with the remaining 28% covering other colors like pink, black, white, grays, browns, and other neutral colors that didn’t fit cleanly into one of my 6 color categories
Here is a pie chart to represent that data, with gray representing the other colors.

Finally, I began the generation and curation phase of this series. Ultimately, I generated over 100 rainbows to then narrow them down to 20 that I loved for the series of prints and NFTs.
Of the 20 in the series, here are the stats on color usage with some visualizations:
Reds:
- 10% of reds were crimson
- 5% of reds were darkred
- 5% of reds were firebrick
- 25% of reds were indianred
- 15% of reds were lightcoral
- 5% of reds were maroon
- 15% of reds were red
- 10% of reds were salmon
- 10% of reds were tomato
- 25% of oranges were coral

Oranges:
- 25% of oranges were coral
- 10% of oranges were darkorange
- 10% of oranges were lightsalmon
- 10% of oranges were navajowhite
- 10% of oranges were orange
- 15% of oranges were orangered
- 20% of oranges were sandybrown

Yellows:
- 10% of yellows were cornsilk
- 10% of yellows were gold
- 10% of yellows were ivory
- 10% of yellows were khaki
- 25% of yellows were lemonchiffon
- 15% of yellows were lightgoldenrodyellow
- 5% of yellows were lightyellow
- 10% of yellows were palegoldenrod
- 5% of yellows were yellow

Greens:
- 10% of greens were aquamarine
- 10% of greens were darkcyan
- 5% of greens were darkseagreen
- 5% of greens were darkslategray
- 5% of greens were forestgreen
- 10% of greens were greenyellow
- 10% of greens were honeydew
- 10% of greens were lightseagreen
- 5% of greens were limegreen
- 5% of greens were mediumseagreen
- 5% of greens were mediumspringgreen
- 5% of greens were springgreen
- 10% of greens were teal
- 5% of greens were yellowgreen

Blues:
- 5% of blues were cornflowerblue
- 20% of blues were deepskyblue
- 5% of blues were dodgerblue
- 5% of blues were lightblue
- 10% of blues were lightskyblue
- 15% of blues were mediumblue
- 5% of blues were mediumturquoise
- 5% of blues were midnightblue
- 10% of blues were paleturquoise
- 5% of blues were powderblue
- 10% of blues were skyblue
- 5% of blues were turquoise

Purples:
- 5% of purples were darkorchid
- 10% of purples were darkslateblue
- 5% of purples were darkviolet
- 10% of purples were indigo
- 5% of purples were lavender
- 5% of purples were magenta
- 10% of purples were mediumslateblue
- 10% of purples were orchid
- 10% of purples were plum
- 15% of purples were purple
- 5% of purples were rebeccapurple
- 5% of purples were thistle
- 5% of purples were violet

Here is the first rainbow in the series:

I hope you enjoyed reading - I would love to hear what you think!